NEDC vs CLTC vs WLTP vs EPA: EV Range Standards Explained
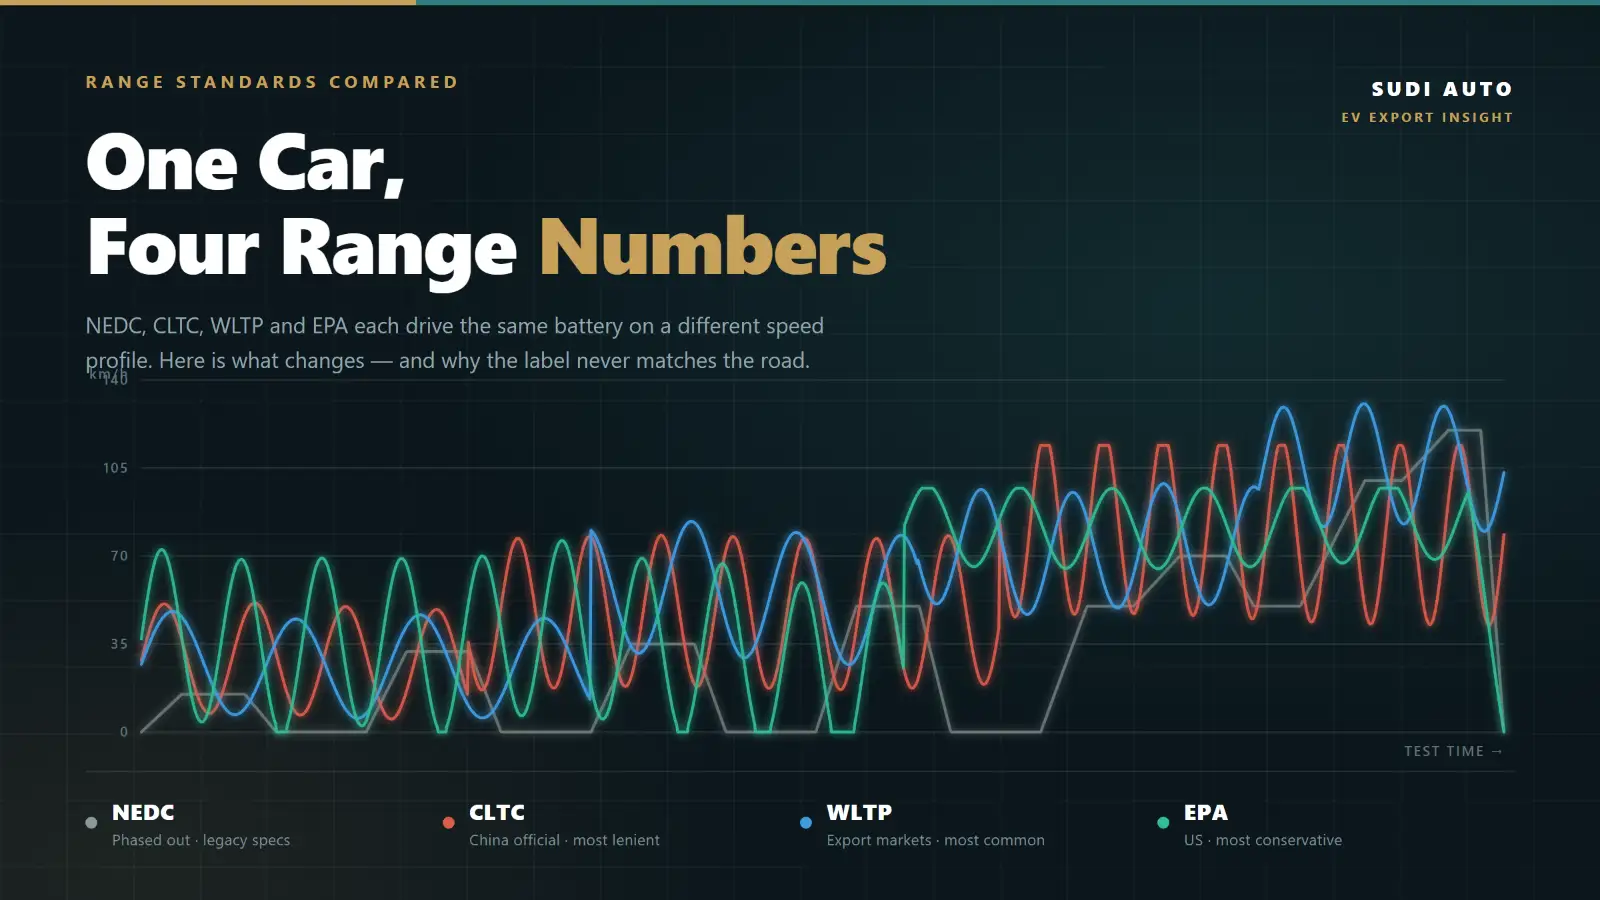
The same BYD Yuan Plus is listed at 510 km on BYD’s Chinese website and 420 km on its European one. The car did not change. The battery did not change. The number fell by 17.6%.
Take another: the 2026 long-range Yuan Plus is rated 630 km CLTC in China and 517 km WLTP for export - a 17.9% gap. Two figures that differ so consistently point to a pattern, not to dishonesty on either side.
For anyone exporting vehicles, these four letter combinations - NEDC, CLTC, WLTP, EPA - are not technical trivia. They are the cost of trust on a quotation sheet. A buyer sees 600 km on the Chinese site, drives 420 km after delivery, and the first thought is not “different test cycles” but “this is not what I ordered.” That is how disputes begin.
This article sets out the test logic, the key parameters and the real conversion factors for all four standards in one place - and shows you how to write them into your quotations and contracts.
1. Start With the Answer: How Strict Is Each Standard
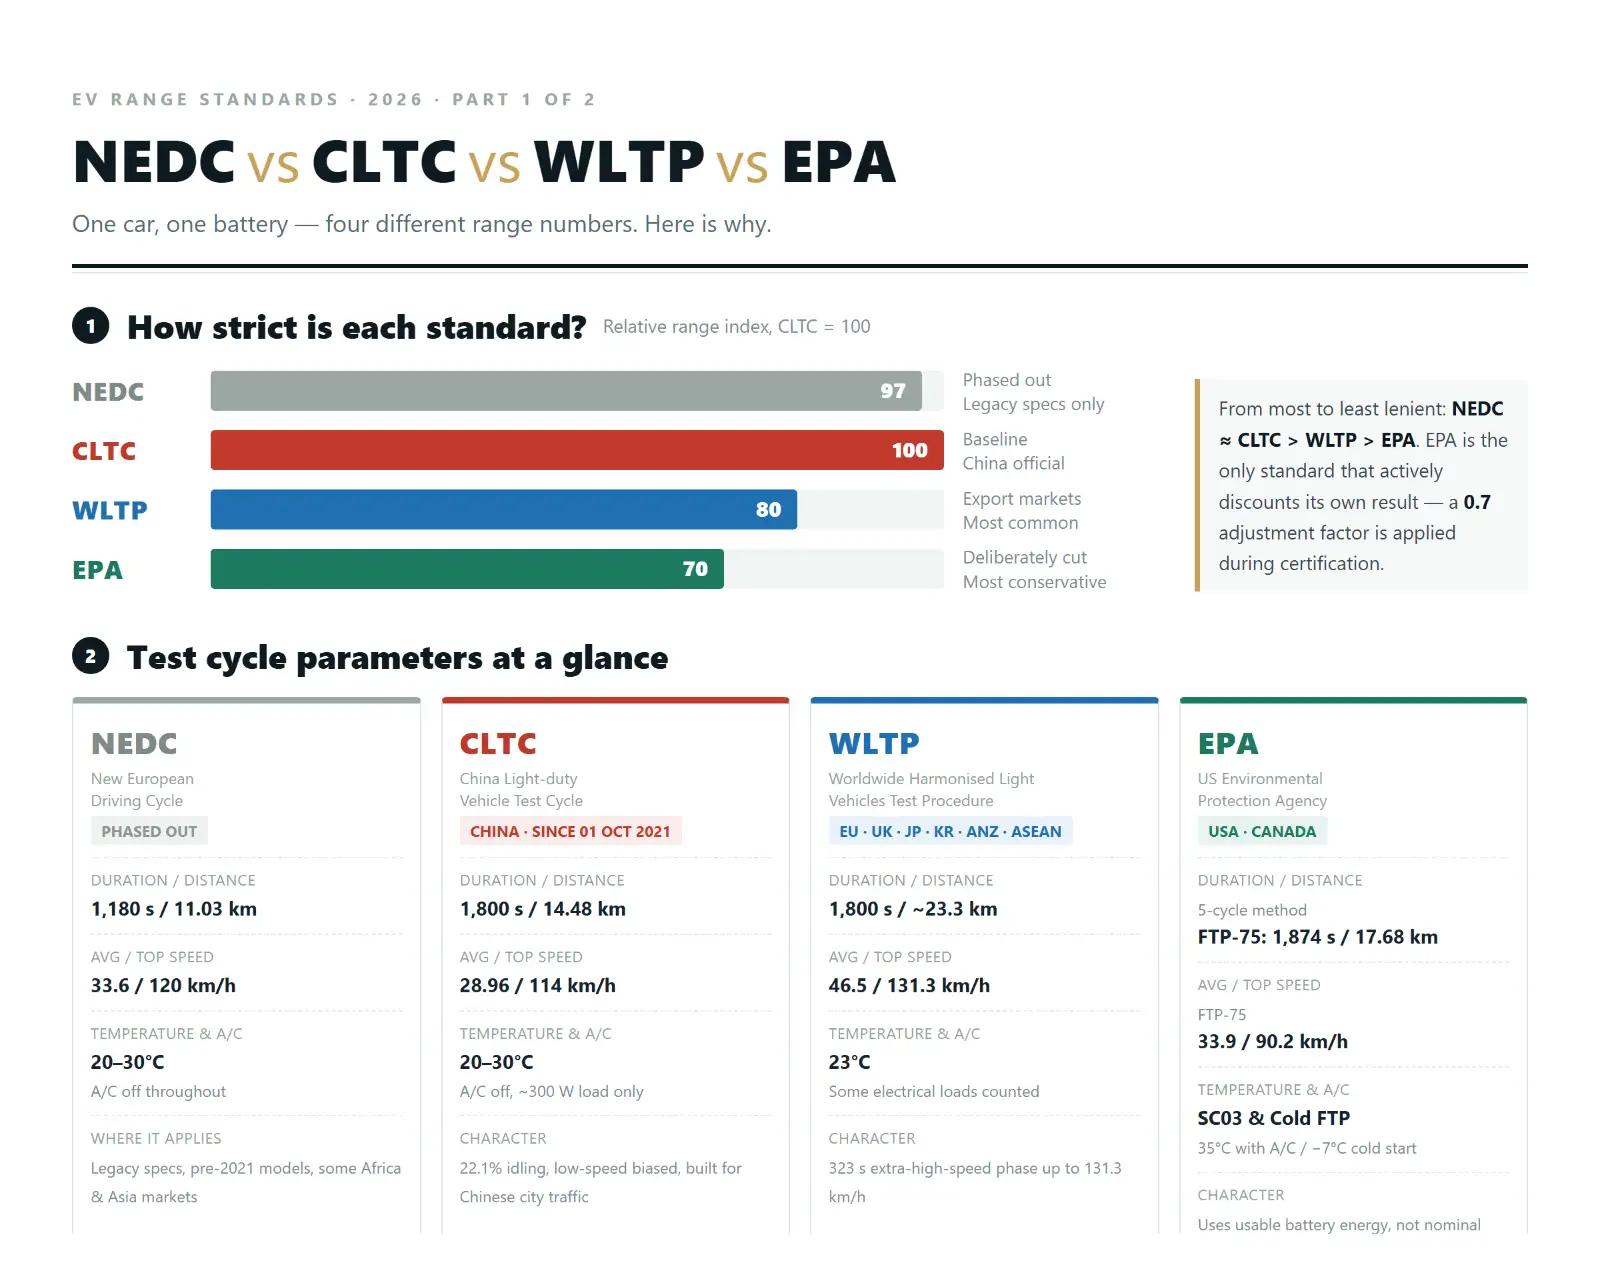
If you remember one thing, remember this: ranked from most to least lenient, the order is NEDC ≈ CLTC > WLTP > EPA. For the same car with the same battery, the published figure falls in roughly that sequence.
One line on each: NEDC is a forty-year-old laboratory fairy tale; CLTC is tailored to congested Chinese traffic; WLTP is the official yardstick you will meet most often in export markets; EPA is the only standard that deliberately cuts its own result.
| Standard | Duration / Distance | Avg / Top Speed | Temperature & A/C | Where It Applies |
|---|---|---|---|---|
| NEDC | 1,180 s / 11.03 km | 33.6 / 120 km/h | 20–30 °C, A/C off throughout | Phased out; only in pre-2021 documentation |
| CLTC-P | 1,800 s / 14.48 km | 28.96 / 114 km/h | 20–30 °C, A/C off, only ~300 W fixed load | China (from 1 Oct 2021) |
| WLTC (Class 3) | 1,800 s / ~23.3 km | 46.5 / 131.3 km/h | 23 °C, electrical loads partly counted | EU, UK, Japan, Korea, ANZ, ASEAN, Middle East |
| EPA | Five-cycle system; FTP-75 is 1,874 s / 17.68 km | 33.9 / 90.2 km/h (FTP-75) | Includes 35 °C with A/C (SC03) and −7 °C cold start | United States, Canada |
2. NEDC: A Forty-Year-Old Laboratory Fairy Tale
2.1 Where It Came From
NEDC (New European Driving Cycle) is built around the ECE-15 urban cycle of the 1970s, and was finalised in 1997 when the EUDC extra-urban cycle was added. The whole test lasts 1,180 seconds and covers 11.03 km, averaging 33.6 km/h with a top speed of 120 km/h, structured as four repeated urban micro-cycles plus one extra-urban segment.
Its speed trace is close to a set of smooth trapezoids: slow acceleration, long cruising, regular stops. That shape was born in the carburettor era to compare fuel-car emissions and consumption, and was later borrowed to label EV range. The borrowing is where the trouble starts.
2.2 Why Its Numbers Look the Best
Three reasons compound:
• Extremely low acceleration. NEDC peaks at just 1.04 m/s², the gentlest of the four cycles - the motor barely enters a high-load band.
• Cruising dominates. Constant speed accounts for 37.5% of the cycle and idling for 22.6%. Cruising costs little energy, and an EV’s drive system consumes almost nothing while stopped.
• The environment is benign. Testing runs at 20–30 °C with air conditioning, seat heating, audio and every other non-drivetrain load switched off.
For a fuel car this mild curve is not wildly unrealistic - idling burns fuel and acceleration injects it. But an EV spends nothing at precisely those points, so NEDC’s “bonus” to electric cars is maximised.
2.3 Is Anyone Still Using It
The EU required new type approvals to report both NEDC and WLTP from September 2017; from September 2018 WLTP became the only legally binding figure, with the transition completed in September 2019. China replaced NEDC with CLTC on 1 October 2021.
You will still encounter NEDC in used-vehicle export and in older stock documentation across parts of Asia, Africa and Latin America, especially for models type-approved before 2021. When you see an NEDC figure, assume it sits 10%–15% above WLTP and build that discount into the negotiation before you start.
3. CLTC: Built for Congested Chinese Traffic
3.1 Where the Data Comes From
CLTC (China Light-duty Vehicle Test Cycle) was led by MIIT and developed by CATARC with industry participation, launched in March 2015. It was built from real road data collected across 41 representative cities and 3,832 vehicles, totalling more than 32 million km - China’s first driving cycle grounded in domestic traffic.
It was published in October 2019 as GB/T 38146.1—2019 (China automotive test cycle - Part 1: Light-duty vehicles) and took effect in May 2020. The specific test method for pure-electric range is set by GB/T 18386.1—2021, which from 1 October 2021 officially replaced NEDC as China’s basis for range labelling.
3.2 What the Curve Looks Like
CLTC-P (the passenger-car part) runs 1,800 seconds over 14.48 km in three phases: low speed 674 s, medium speed 693 s, high speed 433 s. Average speed is 28.96 km/h and top speed 114 km/h.
The time splits are accelerating 28.61%, decelerating 26.44%, cruising 22.83%, idling 22.11%. Against NEDC’s 23.2% / 16.6% / 37.5%, CLTC is visibly more fragmented and choppier - closer to the real stop-and-go rhythm of a Chinese city.
3.3 Why EVs Do Especially Well Under CLTC
This is the key to reading a CLTC number - three physical reasons:
• Low average speed. CLTC-P averages only 28.96 km/h, below NEDC’s 33.6 and WLTC’s 46.5. Aerodynamic drag is small at low speed, and because drag rises roughly with the square of speed, the power needed to overcome it rises with the cube.
• Stopping costs nothing. A fuel car must keep its engine turning at idle; an EV’s drive system draws almost nothing when stationary. CLTC idles 22.11% of the time, and that portion is effectively free.
• Frequent deceleration. Regenerative braking recovers part of the braking energy, reducing friction-brake losses.
One popular misconception needs clearing up: regeneration does not mean “the more stop-and-go, the more efficient.” The battery, motor, inverter and mechanical system all lose energy at every conversion. Regeneration only recovers part of the braking loss - it cannot create energy out of nothing.
3.4 Where the Criticism Lands
CLTC-P is run at 20–30 °C with air conditioning and seat heating off, retaining only about 300 W of fixed electrical load. Criticism concentrates on exactly this point: in real use, summer and winter air conditioning typically accounts for 15%–30% of total consumption, and almost none of that appears in the CLTC figure.
A second commonly misread point is 114 km/h. That is only the peak within the trace - CLTC-P contains no sustained 120 km/h cruising. And highway range loss is precisely the complaint owners raise most often.
The conclusion: there is nothing wrong with CLTC data. It is a strict, repeatable laboratory standard. The problem is treating it as “how far I can drive on an ordinary day.”
4. WLTP: The Official Yardstick in Export Markets
4.1 WLTC and WLTP Are Not the Same Thing
First, the terminology - these two abbreviations are constantly mixed up. WLTC (Test Cycle) is the speed-versus-time trace. WLTP (Test Procedure) is the entire test procedure: besides the trace it defines vehicle classification, test mass, road-load determination, laboratory conditions, battery preparation, data interpolation and conformity requirements. The legal basis is UNECE R154.
4.2 Curve Design: Four Phases, Including an Extra-High-Speed Section
Mainstream passenger cars fall under WLTC Class 3 (power-to-mass above 34 kW/t), which is split into four phases:
| Phase | Duration | Distance | Top Speed | Stopped Time | Avg Speed (incl. stops) |
|---|---|---|---|---|---|
| Low | 589 s | 3,095 m | 56.5 km/h | 26.5% | 18.9 km/h |
| Medium | 433 s | 4,756 m | 76.6 km/h | 11.1% | 39.4 km/h |
| High | 455 s | 7,162 m | 97.4 km/h | 6.8% | 56.5 km/h |
| Extra-high | 323 s | 8,254 m | 131.3 km/h | 2.2% | 91.7 km/h |
| Total | 1,800 s | 23,266 m (~23.3 km) | 131.3 km/h | 13.4% | 46.5 km/h |
Placing it beside CLTC-P makes the point immediately. Over the same 1,800 seconds, WLTC covers 23.3 km while CLTC-P covers just 14.48 km - 61% further, at a 61% higher average speed. More importantly, WLTC includes a 323-second extra-high-speed phase peaking at 131.3 km/h, which CLTC-P does not contain at all.
That phase is unkind to EVs: aerodynamic drag climbs steeply with speed, and an electric car has no gearbox to dilute the effect. WLTP figures usually sit below CLTC, and the extra-high-speed phase is one of the main reasons.
4.3 Specification Sensitivity: An Easily Overlooked Detail
WLTP handles the different specifications of a single model through a “vehicle family plus interpolation” approach: the highest-consuming (vehicle H) and lowest-consuming (vehicle L) configurations in the family are tested, and the variants in between are derived by interpolation.
Test mass = kerb mass + specified payload. Differences in rolling and aerodynamic drag arising from wheel size, tyre specification and optional equipment all feed into the final figure through the measured road load.
The result: the same model on 18-inch and 19-inch wheels can receive different WLTP range figures. That matters directly when you specify export configurations - if you want a better number, keep the specification conservative.
5. EPA: The Only Standard That Actively Cuts Its Own Number
5.1 What Each of the Five Cycles Covers
EPA uses a five-cycle method, each cycle covering one class of real-world scenario:
• FTP-75 (UDDS) - city driving, 1,874 s over 17.68 km, averaging 33.9 km/h and peaking at 90.2 km/h, including both cold-start and hot-start phases.
• HWFET - highway driving, averaging about 77.7 km/h with a 96.6 km/h peak, simulating motorway cruising.
• US06 - aggressive driving, averaging 77.9 km/h and peaking at 129 km/h, with heavy hard acceleration and braking; the most demanding cycle of the four standards.
• SC03 - the air-conditioning cycle, run at 35 °C with air conditioning on throughout.
• Cold FTP - cold start at approximately −7 °C (20 °F).
5.2 How EVs Are Tested: MCT and “Usable Energy”
Battery-electric vehicles are tested under the SAE J1634 Multi-Cycle Test (MCT): the car repeats standard cycles on a dynamometer until the battery is depleted, the standard sequence being four UDDS segments plus two HWFET segments, with constant-speed depletion segments inserted according to battery capacity.
The car is then fully recharged and the AC energy drawn from the grid is measured, establishing “usable battery energy”. Note that definition carefully - EPA uses usable capacity, not nominal total capacity, and it also strips out BMS buffers and charging losses. Working backwards from the battery kWh figure in the brochure will never reconcile.
5.3 What the 0.7 Figure Actually Means
In EPA certification for BEVs, manufacturers are usually required to run only UDDS and HWFET. They then have two options:
• Option A - run only those two cycles and apply a flat 0.7 default adjustment factor to the result, estimating the effect of US06, SC03 and Cold FTP.
• Option B - run all five cycles and derive their own factor (five-cycle combined consumption divided by two-cycle combined consumption), which in practice commonly lands between 0.75 and 0.85.
The combined range is weighted 55% city / 45% highway. It is this deliberate downward adjustment that makes EPA the most conservative of the four standards - and the closest to what North American drivers actually experience.
5.4 EPA Is Strictest, But Not “the Only Correct One”
EPA is designed so that most users’ real-world range will not fall below the labelled figure. The trade-off is that it is pessimistic for gentle driving and low-speed commuting.
If your fleet runs short urban deliveries in a temperate climate, EPA will actually understate what the vehicle can do. Choosing a standard depends on your operating profile - not on which number is more “honest”.
6. Conversion: A Credible Basis for Your Quotation
6.1 Empirical Conversion Factors
Below are the ranges commonly used across the industry for quick estimates:
| From → To | Multiply By | Notes |
|---|---|---|
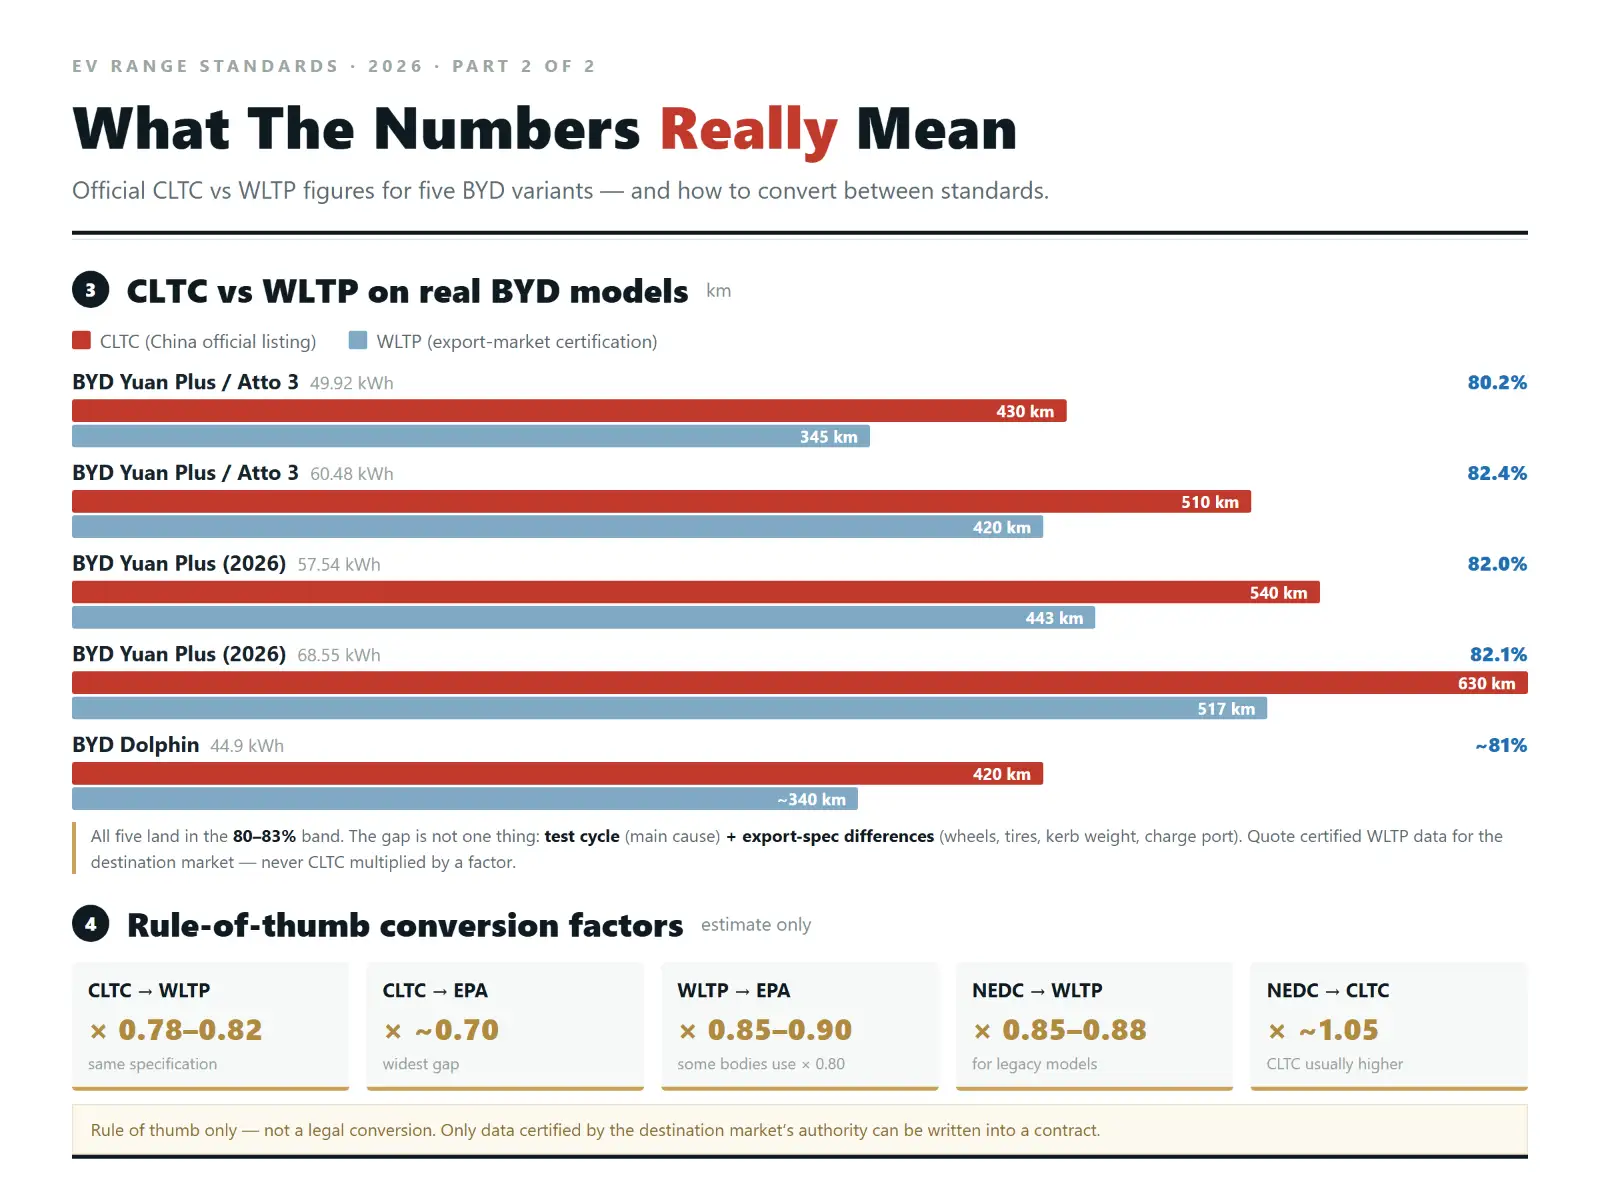
| CLTC → WLTP | × 0.78 – 0.82 | Assuming identical specification |
| CLTC → EPA | × ~0.70 | The widest gap in the set |
| WLTP → EPA | × 0.85 – 0.90 | Some bodies use × 0.80 |
| NEDC → WLTP | × 0.85 – 0.88 | For legacy models |
| NEDC → CLTC | × ~1.05 | CLTC is usually slightly above NEDC |
This has to be said plainly: these are empirical ranges, not legal conversions. Any conversion can serve for estimation only, never as a committed value in a contract. The only figure that belongs in a contract is measured data issued by the certification body in the target market.
6.2 Real Comparisons From BYD Models
The set below is drawn from published official information, and is more persuasive than any conversion formula:
| Model | Battery | CLTC | WLTP | WLTP / CLTC |
|---|---|---|---|---|
| Yuan Plus / Atto 3 | 49.92 kWh | 430 km | 345 km | 80.2% |
| Yuan Plus / Atto 3 | 60.48 kWh | 510 km | 420 km | 82.4% |
| Yuan Plus (2026) | 57.54 kWh | 540 km | 443 km | 82.0% |
| Yuan Plus (2026) | 68.55 kWh | 630 km | 517 km | 82.1% |
| Dolphin | 44.9 kWh | 420 km | ~340 km | ~81% |
All five pairs land inside the 80%–83% band - a remarkably tight spread. For reference, the Atto 3 Evo (74.88 kWh, rear-wheel drive) is rated 510 km WLTP while the all-wheel-drive version is 470 km: drivetrain alone accounts for a 40 km difference within the same model.
One further comparison from the same source: when CATARC ran a single test vehicle through all four cycles, consumption came out at CLTC 12.8 kWh/100 km, NEDC 13.8, WLTP 16.8 and EPA 17.1. The cycle with the higher consumption yields the shorter range - the logic is entirely self-consistent.
6.3 Do Not Overlook: the Export Spec Is Not the Same Car
In fairness, one thing must be stated openly: not all of that 17%–20% gap comes from cycle severity. Export and domestic versions usually differ in these respects:
• Wheel and tyre specification, directly affecting rolling and aerodynamic drag
• Kerb mass (equipment level, glazing, spare wheel, charging equipment)
• Charging interface and on-board charger specification
• Thermal-management calibration in certain markets
So the precise formulation is: the CLTC-to-WLTP gap = cycle difference + specification difference. When you quote, cite the WLTP data issued by the target market’s certification body rather than multiplying a CLTC figure by a factor - to the buyer, the latter looks like a numbers game.
7. Three Range Killers That Bite Harder Than the Cycle
Even with all four standards mastered, the three variables below can invalidate a carefully calculated number. Their effect on real range is often larger than the choice of standard.
7.1 Cold Weather
Low-temperature testing published by CATARC in January 2026 shows that at −7 °C, mainstream EVs lose about 39% of their range on average. In Autohome’s extreme-winter test in Yakeshi, Inner Mongolia (ambient −10 °C to −25 °C) in late 2025, pure-electric models achieved an average of just 42% of claimed range under the snow-limit condition.
There are two layers to the cause. At low temperature the internal resistance of a lithium-ion cell rises and available discharge power falls. More importantly, there is cabin heating: a fuel car warms itself with engine waste heat, while an EV can only draw from the battery - and a resistive heater runs at 3–5 kW continuously, which at highway speed can be 15%–20% of total consumption.
One point needs particular emphasis: LFP cells perform worse in the cold than NMC. BYD fits blade batteries (LFP) across its range. In winter markets such as Eastern Europe, Central Asia and Northern Europe, you must recalculate operating cost on a winter achievement rate rather than copying the CLTC figure.
7.2 Highway Driving
Most EVs achieve 60%–70% of rated range at a steady 120 km/h - the industry norm. The physics is straightforward: drag rises with the square of speed, and the power required to overcome it with the cube. Moving from 100 km/h to 120 km/h raises the drive power needed to hold speed substantially.
If your use case is intercity logistics, airport transfers or long-distance passenger transport, take 30% off the CLTC figure to arrive at usable range.
7.3 Air Conditioning, Payload and Tyres
Hard acceleration and braking add 15%–20% to consumption; low tyre pressure, larger wheels and roof racks eat into range continuously; full loads and gradients matter just as much. Stacked together, these variables explain why the same car can produce completely different results in different drivers’ hands.
8. How Importers and Fleet Buyers Should Use These Four Numbers
8.1 Three Questions to Ask When You Request a Quote
• Which cycle was this range figure measured on, and is there an official document from the target market’s certification body?
• Is the battery figure nominal total capacity or usable capacity? (EPA uses usable capacity; most marketing material uses total capacity.)
• Is there measured data for low-temperature and highway conditions?
8.2 Choose the Labelling Basis by Target Market
| Target Market | Official Basis | Notes |
|---|---|---|
| China | CLTC | GB/T 18386.1—2021 |
| EU, UK, Switzerland | WLTP | UNECE R154 |
| Japan, Korea, Australia & New Zealand | WLTP | Local implementation rules vary slightly |
| Most ASEAN and Middle East markets | WLTP | Some countries still accept legacy NEDC data |
| United States, Canada | EPA | Natural Resources Canada applies the EPA five-cycle method |
| Parts of Latin America | Local certification | Brazil and others run separate systems; confirm case by case |
9. Frequently Asked Questions
Q1: Is CLTC “inflated”?
A: No. CLTC is a strict, repeatable laboratory standard. Test conditions, payload, ambient temperature, energy measurement and result calculation are all set by national standards, and manufacturers cannot adjust them at will. The dispute is about what it simulates: mild urban driving, with no air conditioning, no extreme cold and no sustained high speed. The number is real; the scenario it applies to is narrow.
Q2: The same car is rated 600 km domestically and 480 km for export - has it been decontented?
A: Usually not. Take the BYD Yuan Plus: the 60.48 kWh version is 510 km CLTC and 420 km WLTP, a 17.6% difference; the 2026 68.55 kWh version is 630 km CLTC and 517 km WLTP, a 17.9% difference. The gap comes mainly from the test cycle, and secondarily from specification differences in the export version - wheels, tyres, kerb mass and charging interface. To judge whether a car has been decontented, look at the three hard indicators: battery capacity, motor power and kerb mass. Not the range figure.
Q3: Which number should I actually trust?
A: It depends what you are using it for. To compare different models side by side, use figures from the same standard - that is the core value of a test cycle. To estimate everyday range, WLTP sits closer to mixed driving in temperate regions and EPA closer to the conservative North American experience. CLTC works well as an upper reference for Chinese urban conditions.
Q4: Roughly how far apart are EPA and WLTP?
A: EPA typically falls 10%–20% below WLTP; the common conversion is EPA ≈ WLTP × 0.85. The gap comes mainly from EPA’s 0.7 adjustment factor, plus the inclusion of the SC03 air-conditioning cycle and the Cold FTP low-temperature cycle.
Q5: What discount should I apply in winter?
A: CATARC’s January 2026 data puts average range loss at around 39% at −7 °C - roughly a 40% discount. Below −15 °C with frequent heater use, some models lose half their range. Models fitted with a heat pump perform noticeably better than those using resistive heating.
Q6: Does LFP differ much from NMC in winter?
A: Noticeably. LFP cells lose more capacity at low temperature than NMC, and because their voltage curve is flat the displayed state of charge can drop suddenly - known in the industry as “cliff-edge” discharge. For operation in severe winter markets, prioritise configurations with battery thermal management and a heat pump.
Q7: What share of the rated figure can I actually drive at 120 km/h?
A: For a car rated under CLTC, real range at a steady 120 km/h is typically 60%–70% of the label. A 600 km rating means roughly 360–420 km on the highway. For long-distance intercity operation, plan your charging stops on that basis.
Q8: How should range be labelled when exporting used vehicles?
A: Do not carry over the original new-car CLTC figure. Batteries degrade with cycle count, so a used vehicle should be labelled on its current usable capacity and marked “measured range” rather than “official cycle range”. If the target market requires official certification data, the vehicle must be re-tested.
10. Final Word
None of the four standards is right or wrong; they answer different questions. CLTC answers “how far can it go under ideal Chinese urban conditions.” WLTP answers “how far under certified mixed-road conditions.” EPA answers “how far can a conservative American owner expect.” Treating them as though they were the same thing is where the trouble starts.
For export business there is only one safe approach: whichever market your customer sits in, speak in that market’s certified data - and declare the cold-weather and highway discounts up front, at quotation stage. Saying it first costs far less than explaining it afterwards.
SudiAuto exports Chinese electric vehicles, with more than 1,000 vehicles delivered, USD 23 million in cumulative export value and operations across 10+ countries. We focus on BYD. If you are evaluating model specifications for a particular market, you are welcome to request that market’s certification documents directly.
FAQ
Q.Why should I buy from you not from other suppliers?
We are not the cheapest. But we are the kind of company that will still be here even 10 years after you sell the car. — Our group founder & chairman entered the automotive industry in 1985, making him one of China's first auto traders, with over 40 years of experience. All our inventory photos are real shots, not copied from the internet — a reflection of our group's commitment to honest trading.
Q.Who are you?
We are WUXI SUDI AUTOMOBILE NETWORK SERVICE CO., LTD., based in Wuxi City, Jiangsu Province, China, starting from 2024, as a vehicle export team of the Meidi Auto Group. In 2025, we exported over 1,000 vehicles with a trade volume of USD 23 million, serving customers across four continents.
Q.How can you guarantee quality?
Always Inspection before shipment. We can conduct vehicle inspections by a third party based on the customer's requirements and issue a reliable report. Our partners include institutions such as APT and Dr. Cha.
Q.Do you have the products in stock?
Yes, our current inventory cars are displayed on the website. You can browse at any time. Large quantities must be produced according to orders, and small quantities can be consulted with our sales team.
Q.What can I buy from you?
All vehicle models of BYD brand, covering Dynasty, Ocean, Linghui, Commercial and many other series. We are the largest BYD dealer in Wuxi City, occupying 90% of Wuxi City market. We cooperate directly with BYD factory in China.
Q.Can I mix different models in one container?
Yes, different models can be mixed in one container.
Q.What's your warranty term?
We offer different warranty periods for different products. Please contact us for detailed warranty terms.
Q.Will you deliver the right goods as ordered? How can I trust you?
Yes, we will. The core of our company culture is honesty and credit. We are a verified supplier by V-trust since 2024.
Q.What is your payment?
Payment Currency: USD, HKD, CNY. Payment Type: T/T.
Q.What is your shipping terms?
Delivery Terms: EXW, FCA, FOB, CFR, CIF.
Q.What services can you provide?
Customer visit or car inspection full reception service, product samples or accessory services, etc.
Q.Do you offer right-hand drive (RHD) versions? (Factory Wholesale)
We offer separate LHD (left-hand drive) and RHD (right-hand drive) model lines. Please state your target country when you contact us.
Q.Is the MOQ really 100 units? (Factory Wholesale)
In-stock units have no MOQ — a single unit can be ordered. Made-to-order vehicles start at 100 units, and multiple models can be combined to reach 100.
Q.What are the payment terms for custom orders? (Factory Wholesale)
Typically T/T: 40% deposit + 60% balance. Letters of credit (L/C) require separate negotiation — please contact us.
Q.How long is the lead time? (Factory Wholesale)
For every 100 units, factory production is estimated at 45–90 days, depending on the factory's production schedule and parts supply.
Q.How about export compliance and certification? (Factory Wholesale)
Export customs declaration on the Chinese side is handled by the BYD factory — no action required from the buyer. We can assist with ocean freight booking and documentation. Destination-market homologation is the buyer's responsibility; we provide the required technical documents.